
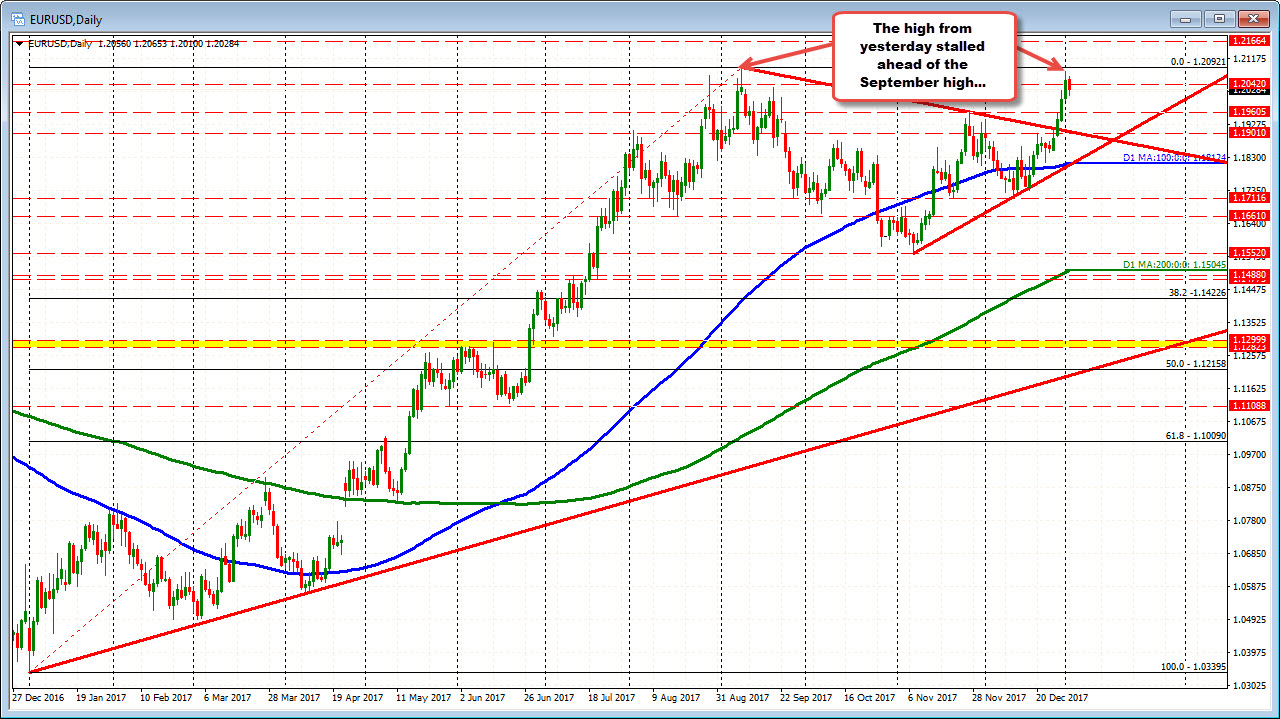
Price could not muster the energy to get above the September 2017 high
Yesterday, the EURUSD extended higher for the 4th straight day, taking the price to the 1.2081 level. That was good but fell short of the September high (2017 high too) at 1.20921. The market backed off as buyers took some profit (see daily chart).
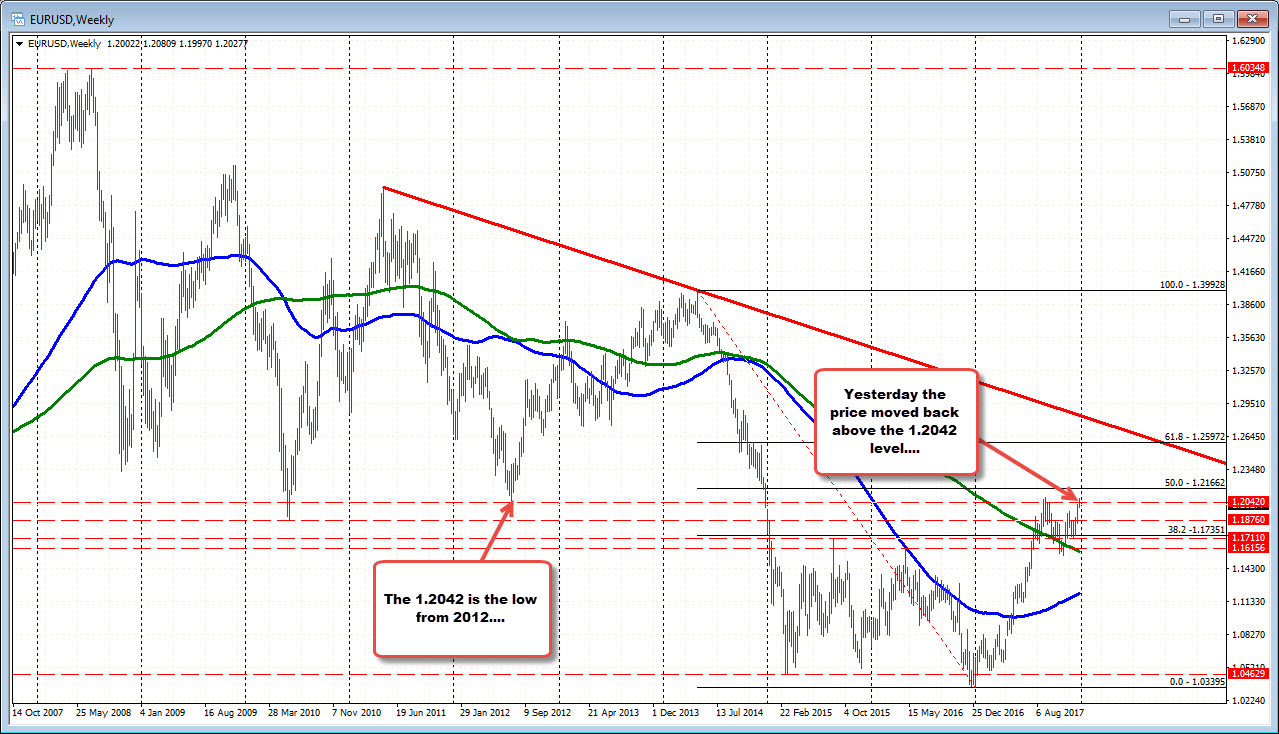
The fall has taken the price back below the 1.2042 level. Recall from yesterday's posts, that was the swing low going back to July 2012 (see weekly chart below and post here). Stay above would keep the buyers more in control. Move below and there could be more corrective potential.
Today, there was more corrective action.
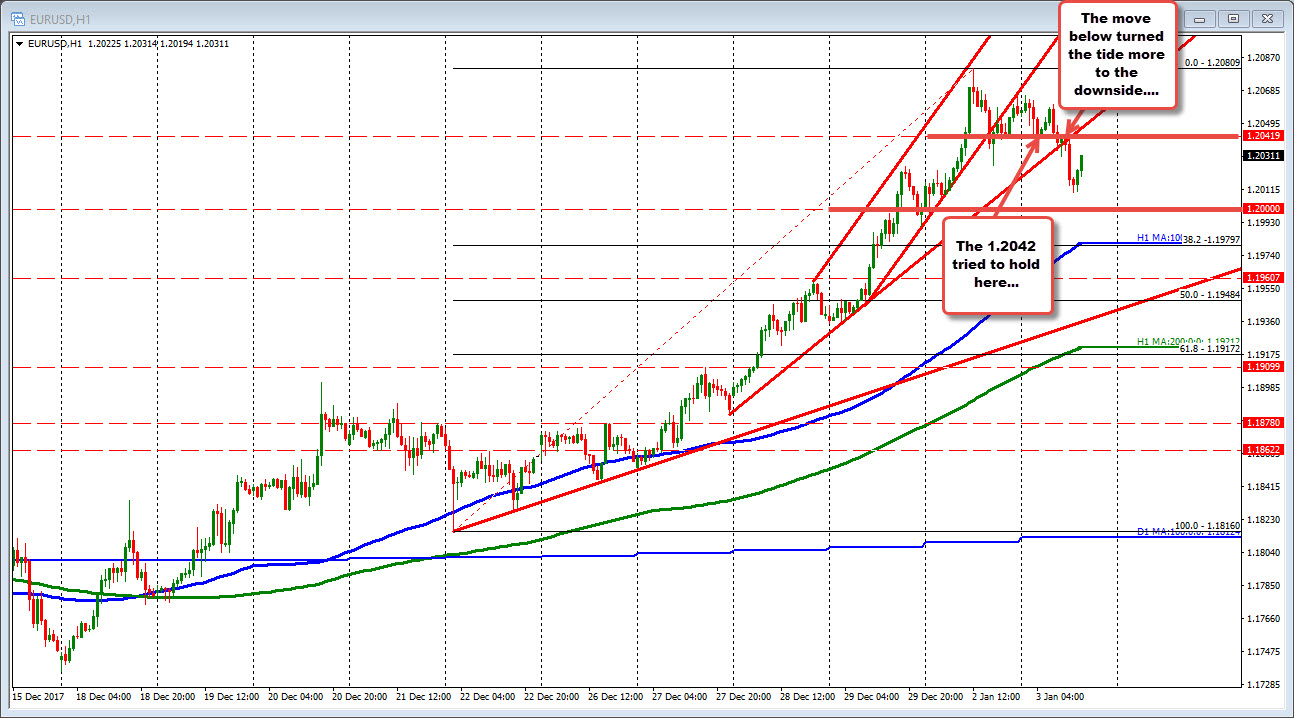
Looking at the hourly chart below, the price in the Asian Pacific session, stalled near that level as traders tried to keep the pair above the level. When that was broken, the buyers wandered more to the sell side. The price ultimately fell with more momentum in the London morning session. The low reached 1.2010.
Is it a disaster so far for the bullish bias? No.
However, in addition to the breaking of the 1.2042 level, the price also cracked a trend line on the hourly chart. That is bearish and at least raises a red, corrective flag.
On the bullish side, the price is staying above the 1.2000 level though and looks like it might look to revisit the 1.2042 level now (trades at 1.2031). If it can take back that level, the sellers will be feeling a little more pressure.
SUMMARY: The EURUSD pair made a corrective move today. The breaking back below the 1.2042 got the ball rolling. However, the move has been limited. A key test for the bias going forward will be around the 1.2042 area. Stay below and a could see more downside/corrective action with a move below the 1.2000 leading to a test of the 100 hour MA at 1.1980 area.
Move above the 1.2042 level, and another test of the 2017 high at 1.2092 will be the target.

