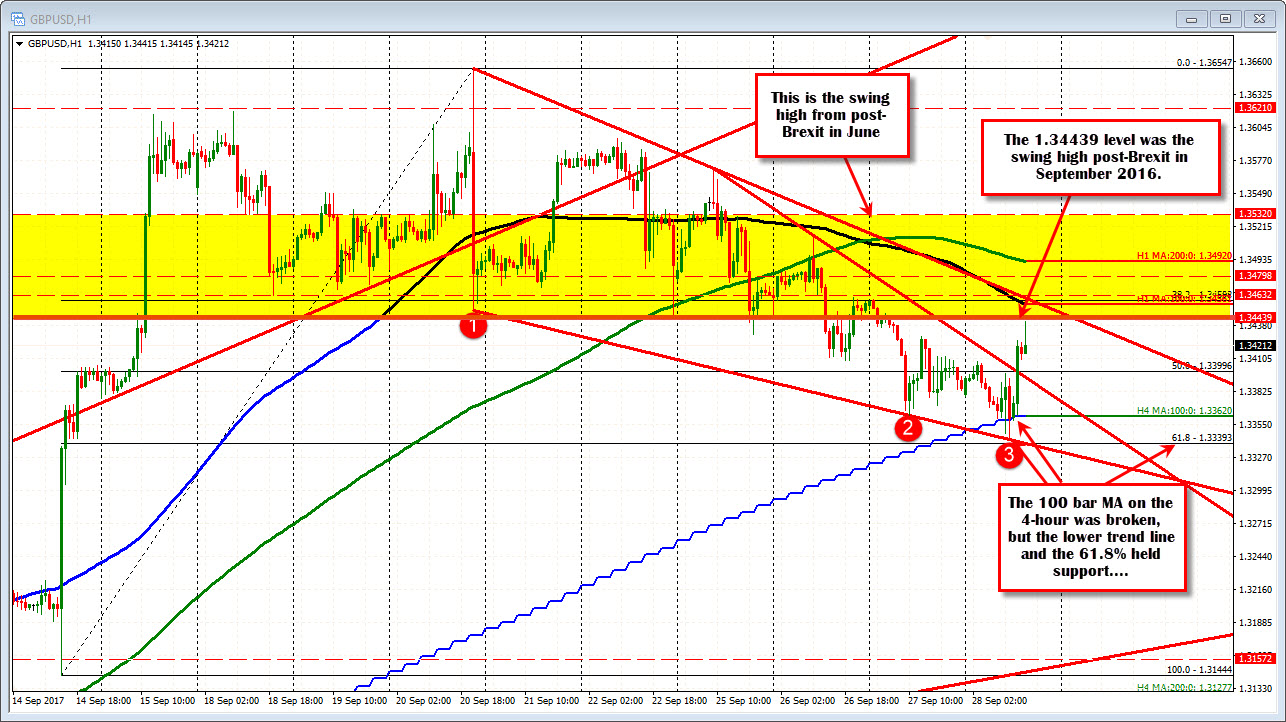
1.34439 tested and held. What next?
I have been talking about the 1.34439-1.3532 area as a level to eye in the GBPUSD (if you are a reader of FXL - see weekly chart below). The area represents the swing highs post-Brexit. 1.3532 was the high in June 2016. 1.3479 was the high in September 2016. The 1.34439 was the swing high from July 2016.
We just moved up to re-test the 1.34439 level. The high stalled at 1.34415. Sellers leaning? It looks that way.
Althoguh bearish, the pair did have a failed break lower earlier in the day. Staying on the weekly chart below, the price fell below the 100 week MA at 1.3360 to a low of 1.3341. That level will be eyed going forward. Get below more bearish. Stay above the battle is on between the 1.3360 and the 1.34439 level above.

Drilling to the hourly chart, the fall below the 100 week MA at 1.3360, was also moving below the 100 bar MA on the 4-hour chart (see blue step line in the chart below). That break hit a lower trend line target and the 61.8% of the move up from September 14th and bounced.
So the technicals get a little more detailed with that technical bounce at the bottom.

Any other levels? The 1.3400 level is a natural technical level and the 50% of the move up from the September 14 low.
SUMMARY; There is some bullish things today:
- Stalled at the trend line
- Failed below the 100 bar MA on the 4-hour
- Higher on the day at 1.3385
- Above the 50% retracement
And there is some bearish:
- The corrective high just hit a key technical resistance level and rejected it at 1.34439.
- The price is below the 100 hour MA at 1.3458
- The trend over the last 6 days is more to the downside.
Intraday, I give a little nod to the buyers but if the pair can get below 1.3400, and turn negative on the day 1.3385, the tide will be going more down again.


