
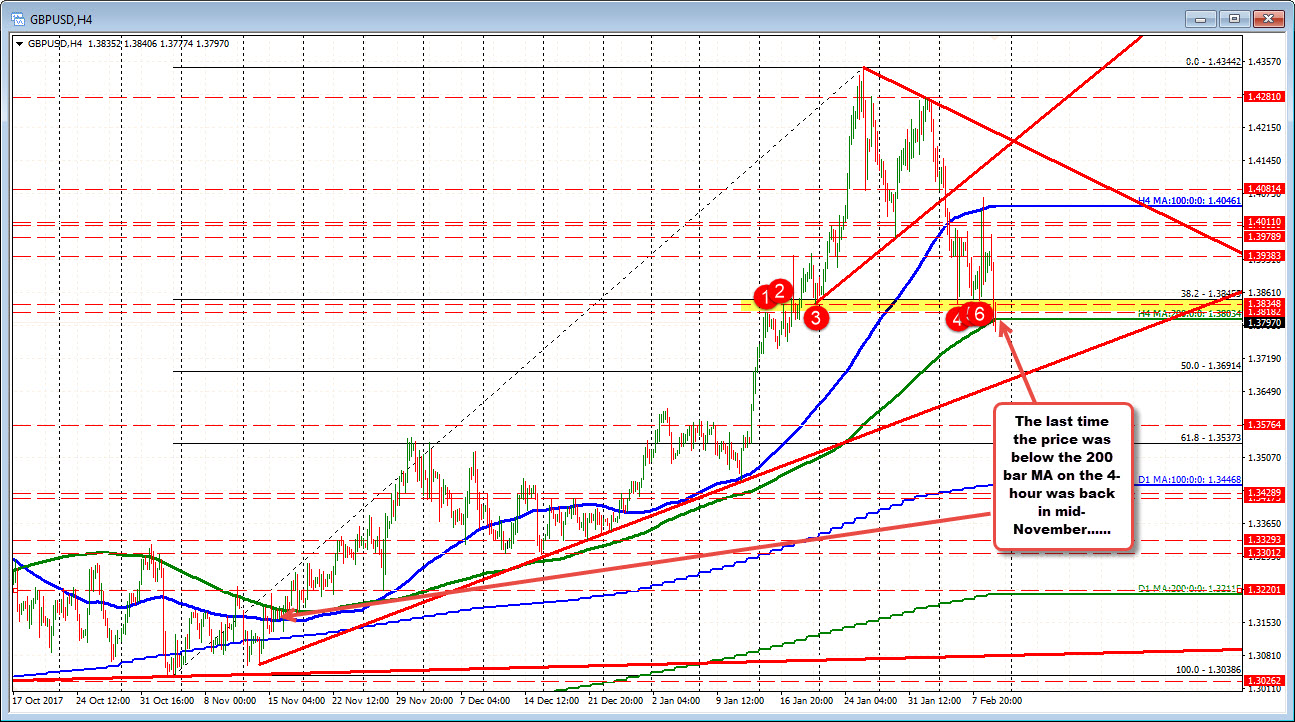
200 bar MA on the 4-hour chart at 1.38034
The GBPUSD moved to new session lows as London/European traders look to exit. In the process, the price has moved back below the 200 bar MA on the 4-hour chart at 1.38034. The price is trading at 1.3790 currently. The last time the GBPUSD traded below that moving average you have to go back to mid November 2017.
What else?
- The 38.2% of the move up November low comes in at 1.3845. We are trading below that level.
- Swing levels going back to mid_January comes in the 1.3818-348 range. We are trading below that area.
- The high correction in the NY session stalled between the 1.3818-45 ceiling area (yellow area in the chart above) at 1.38405.
The sellers are in control.

