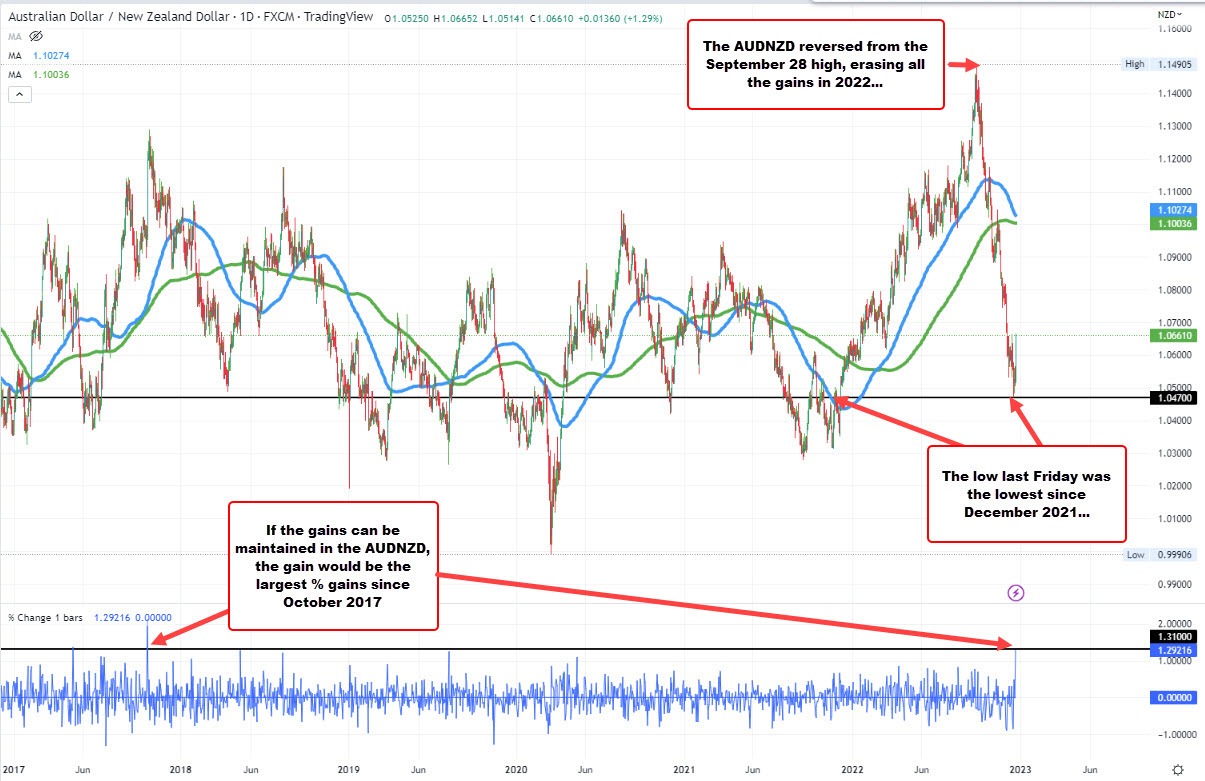
The AUDNZD is trending sharply to the upside today after reaching a new year low on Friday at 1.04695. The high price just reached a new high for the day at 1.0669. That takes the pair up 200 pips over the last 3 trading days or 1.91%.
This week, the price moved higher on Monday, extended up to test the falling 100 hour MA on Tuesday (blue line) before rotating lower and closing unchanged yesterday.
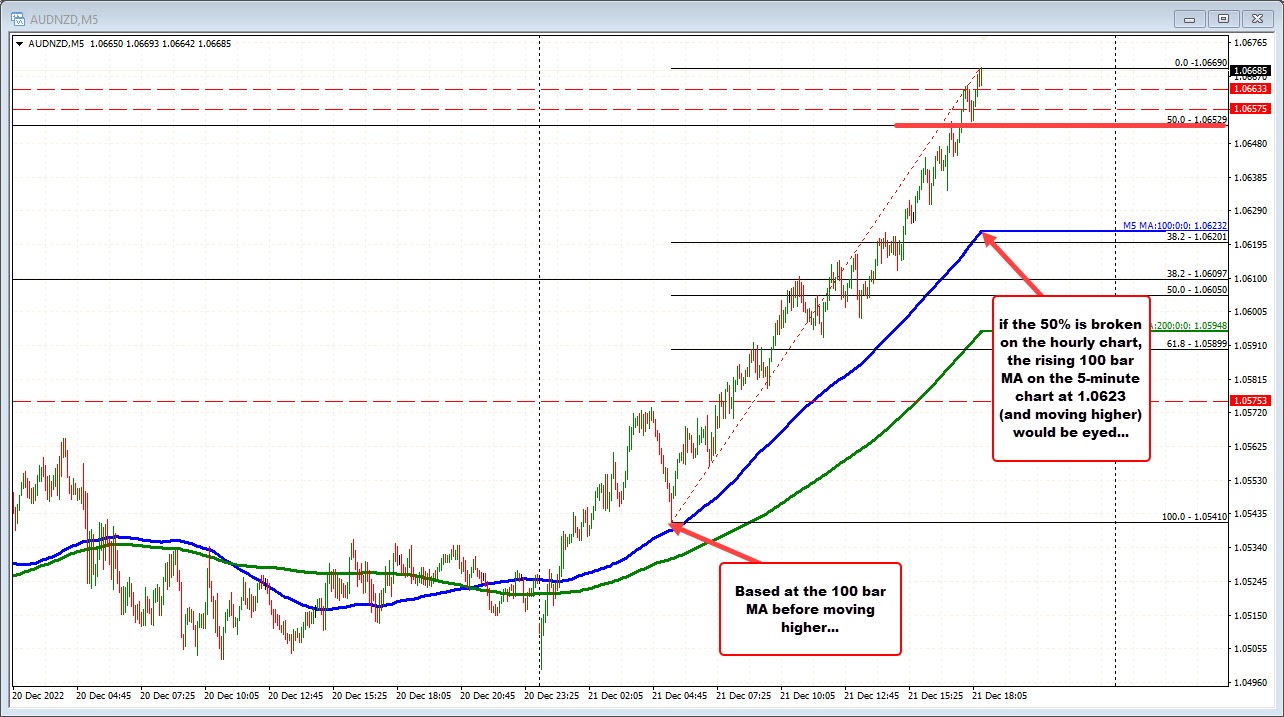
Today, after trading through the 100 hour MA (blue line in chart above), and running up to the 200 hour MA (green lines), the pair retraced back to the 100 hour MA where buyers entered and have trended the pair higher ever since. From the 100 hour MA to the most recent high, the price moved up over 125 pips. The pair is up 1.33% on the day.
If that gain is maintained it would be the largest % increase since October 2017 for that pair.
Looking at the daily chart, the AUDNZD has been trending to the downside since the peak on September 28 reversed what was an uptrend in 2022. The snapback rally today is still only a small blip on that move to the downside, but given the up and down volatility in the pair this year, don't mess with the price action.
For short term trading purposes, the 50% of the move down from the November 21 high comes in at 1.0652. Stay above that is the best case scenario for the buyers looking for even more trend like moves. A move below, could see some additional corrective action.

DISCLAIMER: The volatility in the AUDNZD is documented from the daily chart above. However, it is getting to near year end that may be playing a part.
The technicals can definitely help with that risk and bias assessment. If the 50% is broken on the hourly at 1.06529, a rotation back toward the rising 100 bar MA on the 5 minute chart at 1.0623 (and moving higher) cannot be ruled out (see blue line on the chart below). Earlier today, the dip corrected to the 100 bar MA and found buyers. Since then, there has been little in the way of corrective price action.


