
The breakout of the triangle is a signal that the global economy might be headed for a downturn as the central banks keep monetary conditions tight. The fast rise in energy prices might have also accelerated such an outcome as consumption should have suffered from it. We have also other markets heading towards a negative outcome as global yields continue to soar, the US Dollar appreciates every day and the stock markets are experiencing losses.
Copper Technical Analysis – Daily Timeframe
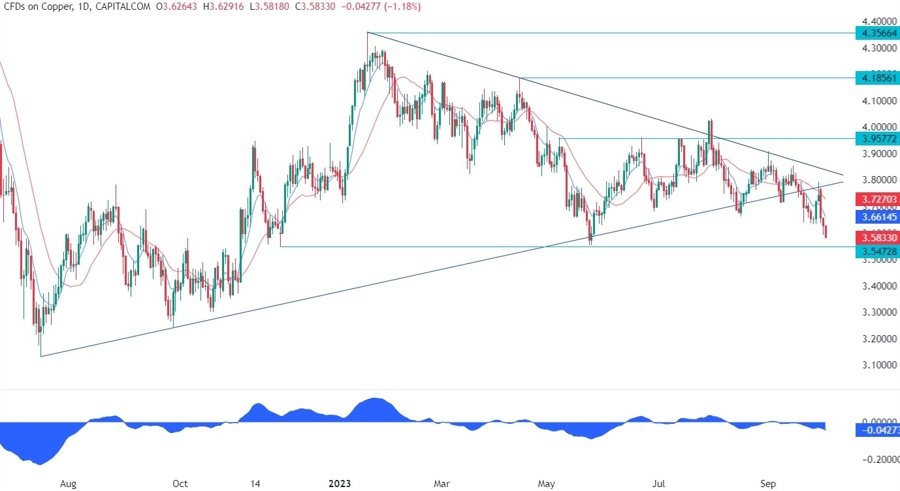
On the daily chart, we can see that after the breakout of the symmetrical triangle, Copper pulled back to retest the broken trendline, where we had also the red 21 moving average for confluence, and sold off again targeting the 3.54 support. We might see a bounce around the support level as the buyers are likely to step in with a defined risk below the level to target a rally into the upper trendline of the triangle. The sellers, on the other hand, will want to see the price breaking through the support to increase the bearish momentum and start eyeing the cycle lows.
Copper Technical Analysis – 4 hour Timeframe

On the 4 hour chart, we can see that we even had another downward trendline around the bottom trendline of the triangle that added an extra layer of confluence. That’s where the sellers piled in with a define risk above the trendline to target the 3.54 support. Right now, the price is in free fall, and we might not see much support until the 3.54 level, so the buyers are likely to be careful not to catch such a falling knife.
Copper Technical Analysis – 1 hour Timeframe

On the 1 hour chart, we can see that the price is starting to diverge with the MACD right as it trades into the key support level. This is generally a sign of weakening momentum often followed by pullbacks or reversals. In this case, we might see the buyers stepping in with conviction around the support level to target the 3.64 resistance. The sellers, on the other hand, are likely to pile in around these levels to position for a break below the support. If the price breaks above the 3.64 resistance as well, then the buyers should have free way until the major trendline around the 3.75 level.
Upcoming Events
Today on the agenda we have the ADP report and the ISM Services PMI. Tomorrow, we will see the latest Jobless Claims data, which continues to show a solid labour market. Finally on Friday, it will be the time for the NFP report which is the only one the Fed will see before its next rate decision. Copper is likely to respond negatively to bad data and positively in case of good figures.

