On the daily chart below, we can see that the price struggled to keep the momentum going as depicted by the multiple doji candles near the 34477 resistance and ultimately failed as the US Retail Sales missed expectations across the board and caused some weakness in the market.
The price is now pulling back, and it looks like the red long period moving average and the support at 33538 are the target. Yesterday’s data also didn’t help as Jobless Claims missed expectations once again and the Philly Fed Manufacturing Index dived to a new low. Today the market will focus on the US PMIs data and if we see a miss, then the market should fall all the way to the support level , but if we get a beat, we should see the buyers piling in and push the price higher.
Dow Jones Technical Analysis

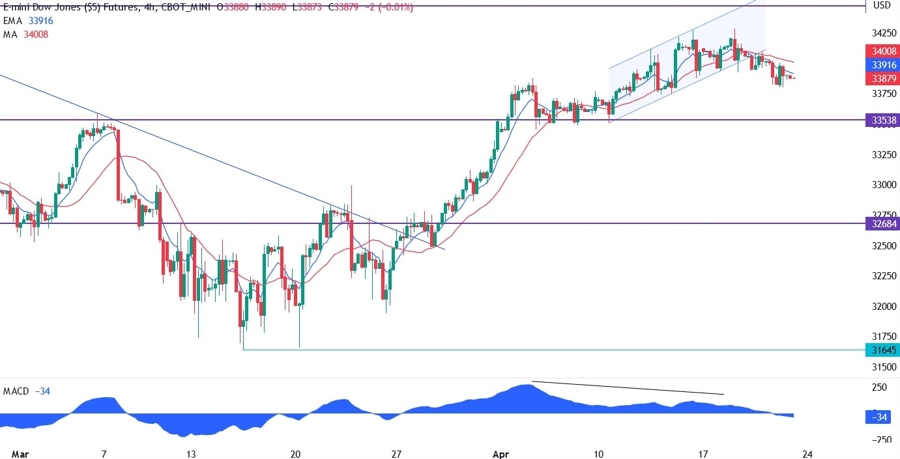
On the 4 hour chart below, we can see that the last leg higher was diverging with the MACD, which is generally a sign of a weakening momentum and is often followed by a pullback or a reversal. Since the price broke out of the channel, the pullback should end at the bottom of the channel which is right at the above mentioned 33538 support.
There is a confluence of many technical tools at that support level, so it would be a good area for the buyers to lean onto. For now, the short-term trend is bearish as signalled by the moving averages crossed to the downside.
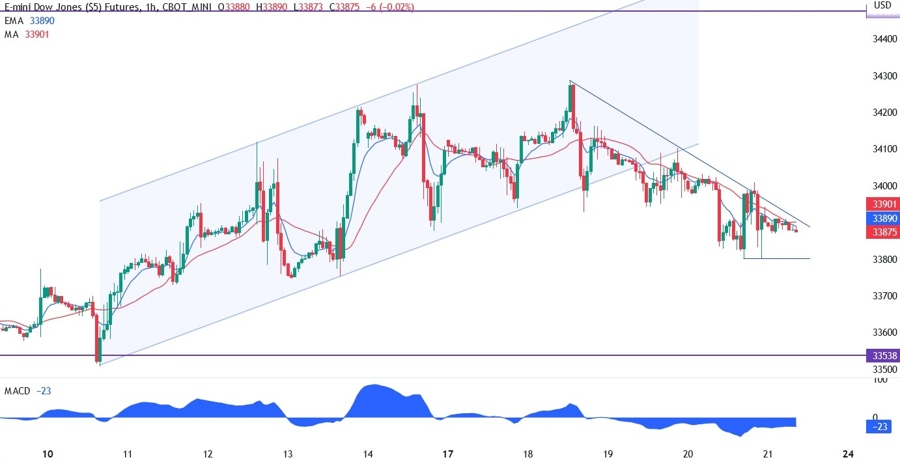
In the 1 hour chart below, we can see that the sellers are in control with the price following the downward trendline path. A lot seems to revolve around today’s data. The buyers may want to see a beat and the price to break above the trendline before piling in and start targeting the resistance at 34477. The sellers, on the other hand, will want to see a miss and the price breaking below the minor support level at 33800 before jumping onboard and push the price to the key support level at 33538.