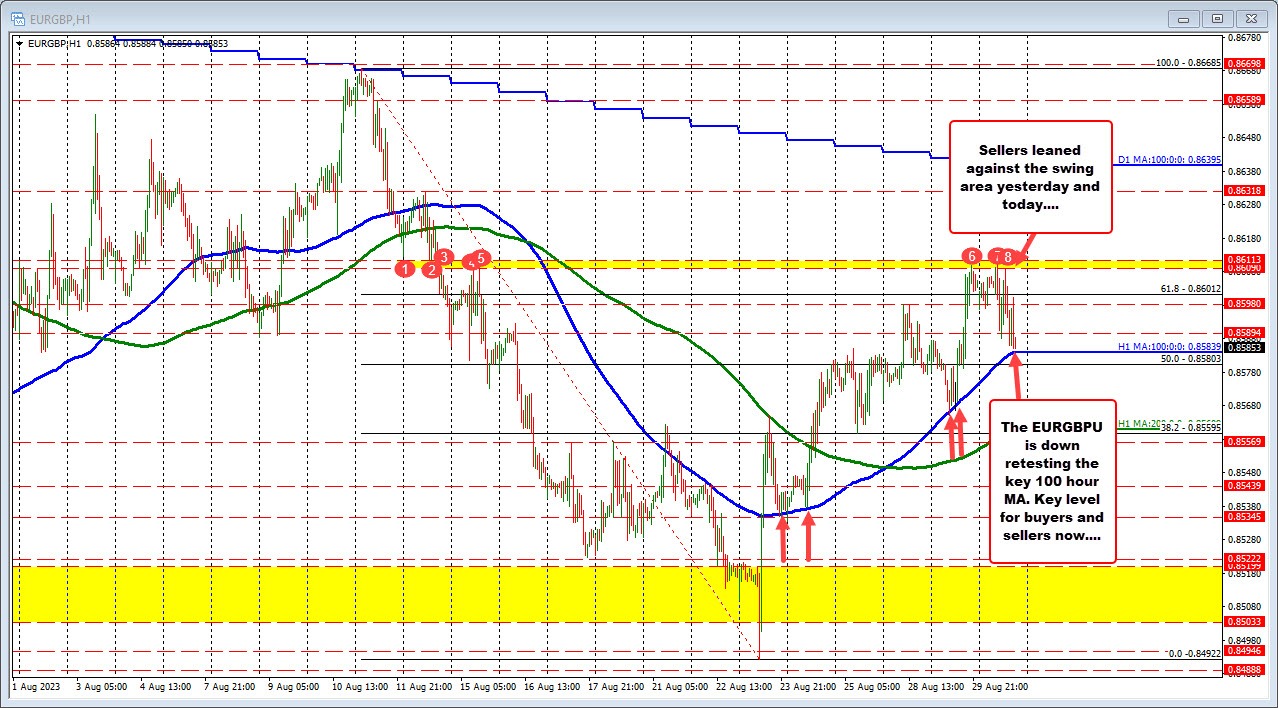
The EURGBP - both yesterday and today - moved up to test a swing area between 0.8609 and 0.8611 (see video yesterday HERE). Sellers leaned on each day. That area's importance increased on the hold. The ceiling is in place.
The up and down move lower today, has now taken the EURGBP pair down to test its rising 100-hour moving average of 0.85839 (blue line in the chart below). That moving average line was tested yesterday and also back on August 24 and August 23. Support buyers came in near that moving average on those days, and pushed the price higher.
As a result, the 100-hour moving average will be a key barometer for both buyers and sellers. Staying above, and we could see a rotation back higher. Moving below - and also below the 50% of the August trading range of 0.85803 - would open the door for further selling potential (the 200-hour moving average comes in at 0.8560 and would be a downside target).


