The GBPUSD moved above its 200 day moving average on the first trading day of December, and after retesting that moving average on December 6 and December 7, the price extended up to the 61.8% retracement of the 2022 trading range at 1.24507 where sellers leaned against the level. Since then the price has returned back toward the falling 200 day moving average currently at 1.20899. The price low today dipped below that level briefly to a low of 1.20845, but has bounced back higher and currently trades at 1.2145.
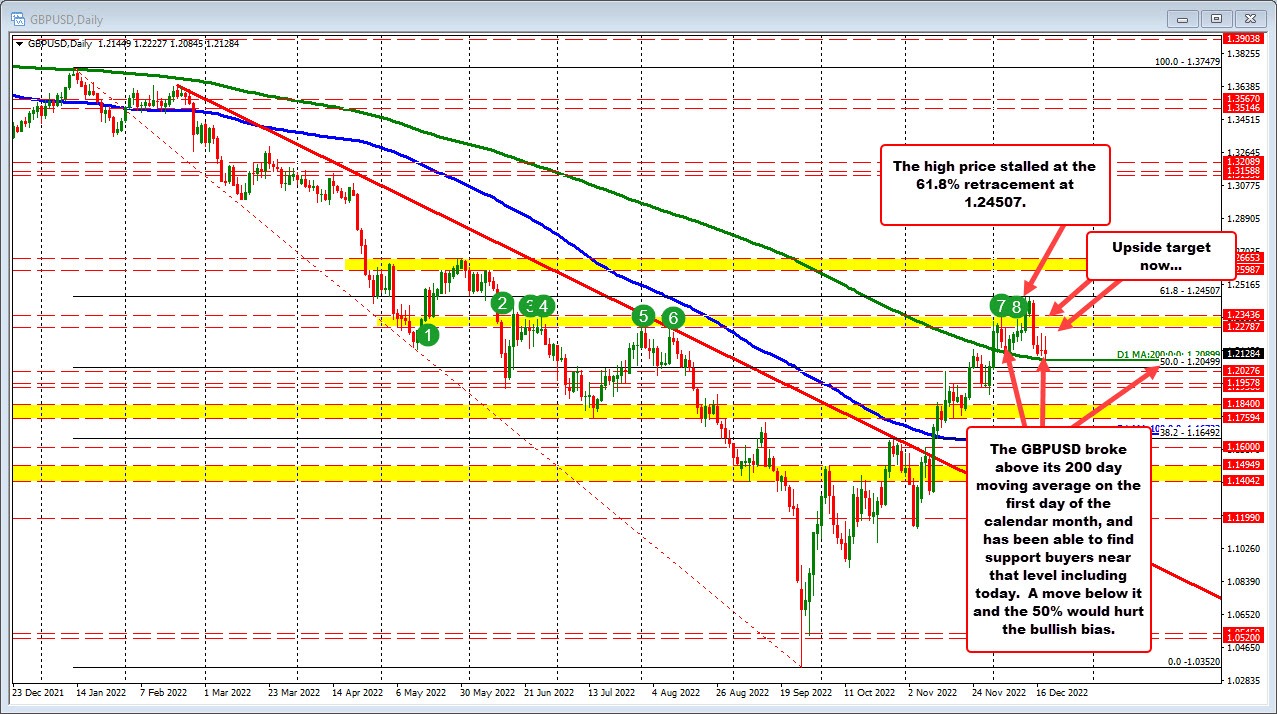
Technically, on the daily chart, it would take a move below the 200 day moving average (at 1.20899), and below the 50% midpoint of the 2022 trading range at 1.20499 to shift the bias more to the downside once again.
What would improve the bullish bias on the daily chart?
The swing area (see green numbered circles on the chart above) between 1.2278 and 1.23436 is the next key target area on the top side to get to and through to increase bullish bias on that chart.
What is the hourly chart telling us from a technical perspective?
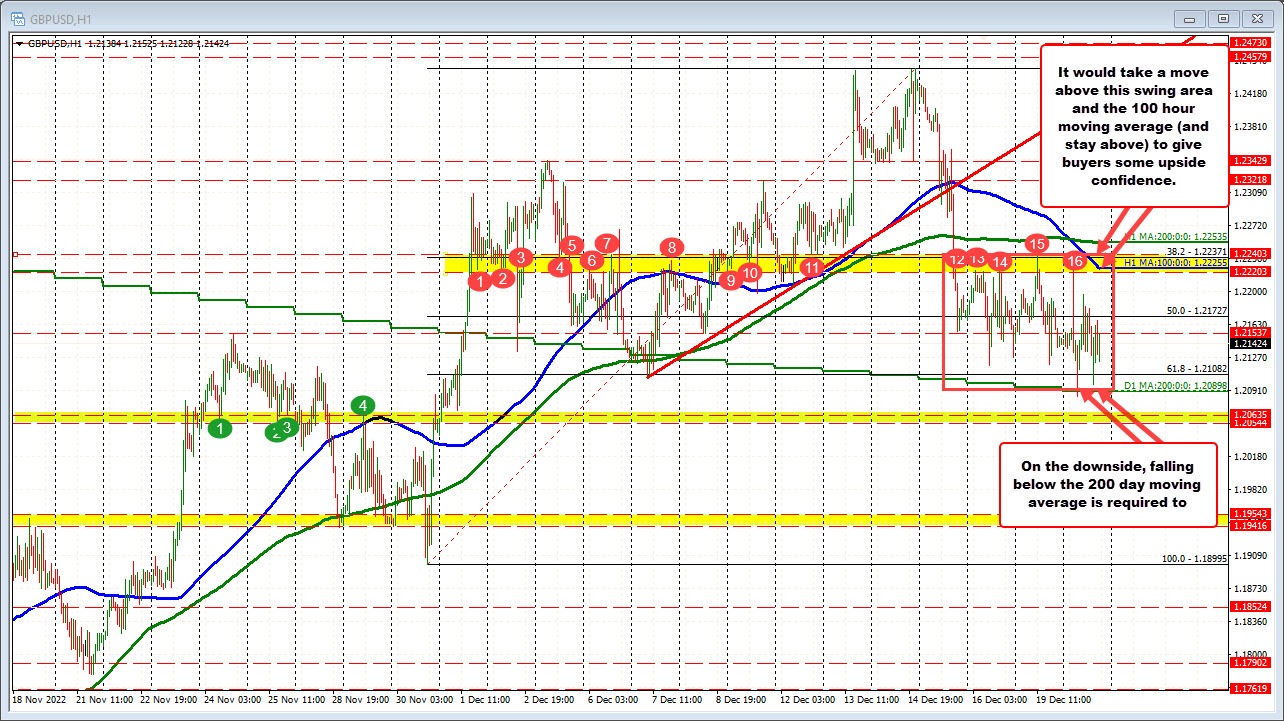
Drilling to the hourly chart below, the price action over the last three trading days has been choppy up and down. The high price from yesterday stalled near the broken 38.2% retracement and near the high of a swing area as well (swing area between 1.22203 – 1.22403 – see red numbered circles). Today, the high price stalled near the low of that swing area at 1.22203.
The falling 100 hour moving average (blue line in the chart below) is also in play as it sits between that swing area at 1.22255 currently.
As a result, it would take a move back above that swing area, and the 100 hour moving average/38.2% retracement to start to hurt the sellers going forward, and increase the bullish bias. Closer resistance may be found against the 50% of the move up from the November 30 low at 1.21727.
Summary: Overall, with the hourly chart tilting more to the downside (below the 100/200 hour MAs), and the daily chart continuing to find support against the 200 day moving average, there is a little something for both buyers and sellers. The up-and-down volatility seen over the last three trading days is congruent with that mixed view technically.
Traders should look for a break at some point with momentum. In meantime expect the up-and-down volatility to continue between the extremes.

