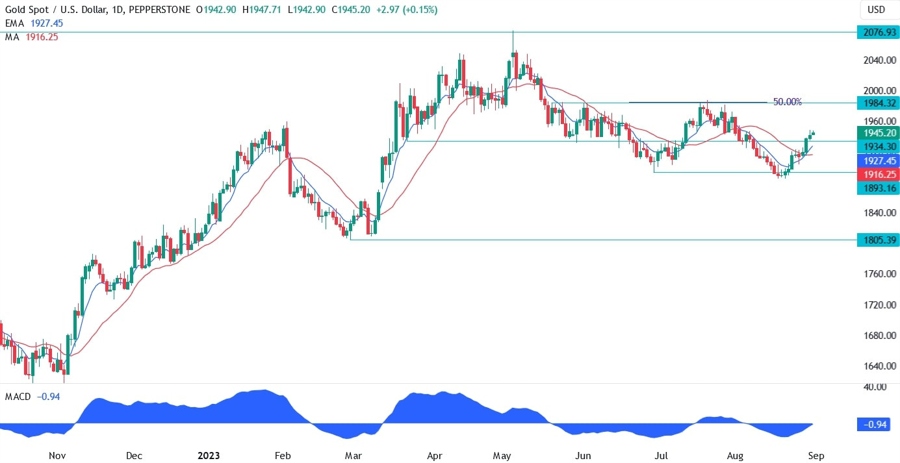
The strong US data in the past months and the quick rise in Treasury yields and the US Dollar weighed a lot on Gold, which threatened at some point a complete breakdown. Recently, we started to see a turnaround in the data beginning with the miss in the US PMIs last week and the big misses in the labour market reports this first half of the week. The market priced out the expectations for further rate hikes from the Fed and brought forward expectations for rate cuts. This caused a selloff in the Treasury yields and the US Dollar ultimately leading to a rally in Gold.
Gold Technical Analysis – Daily Timeframe

On the daily chart, we can see that Gold bounced on the 1893 level and rallied strongly soon after as more and more US data started to miss expectations. The price has even broken out of the red 21 moving average and the resistance at the 1934 level which flipped the bias from bearish to bullish. The next stop should be the key resistance at the 1984 level.
Gold Technical Analysis – 4 hour Timeframe

On the 4 hour chart, we can see that we had a divergence with the MACD as the price was falling into the 1893 level. This is generally a sign of weakening momentum often followed by pullbacks or reversals. In this case, as the price broke out of the trendline, the reversal was confirmed and coupled with the bad US data the buyers piled in aggressively to ride the bullish wave. The price is now trading within a channel and from a risk management perspective, the buyers would be better off to wait for a pullback into the lower bound of the channel before taking new positions.
Gold Technical Analysis – 1 hour Timeframe

On the 1 hour chart, we can see that we have another divergence right when the price is trading around the upper bound of the channel. This might be just a confirmation that a pullback is due, and the most likely support should be the lower bound of the channel where we find the confluence with the previous resistance turned support, the 38.2% Fibonacci retracement level and the 4-hour 21 moving average. This is where the buyers should pile in with a defined risk below the level and target new higher highs. The sellers, on the other hand, will want to see the price breaking lower to position for another drop into the lows.
Upcoming Events
This week is all about the US labour market data and the recent releases haven’t been encouraging on a forward-looking basis. Today, the main event will be the US Jobless Claims report accompanied by the US PCE data. Tomorrow, we conclude the week with the US NFP and ISM Manufacturing PMI reports. Weak data should support Gold, while strong readings should lead to weakness, so it will be crucial to watch the releases in the next few days and weeks.


