
On the daily Nasdaq chart below, we can see that after the selloff in February, the market bounced right at the 61.8% Fibonacci retracement level. The breakout of the trendline and the cross to the upside of the moving averages were signalling a possible bull flag in play, but the buyers needed to break the previous swing resistance first to confirm the pattern.
They did it. The target for the bull flag looks insane as it stands at the August 2022 high at 13186, but we’ve seen time after time how the dip buyers managed to push the market up even though many bad news have been thrown to them, so at this point it wouldn’t be a surprise anymore.
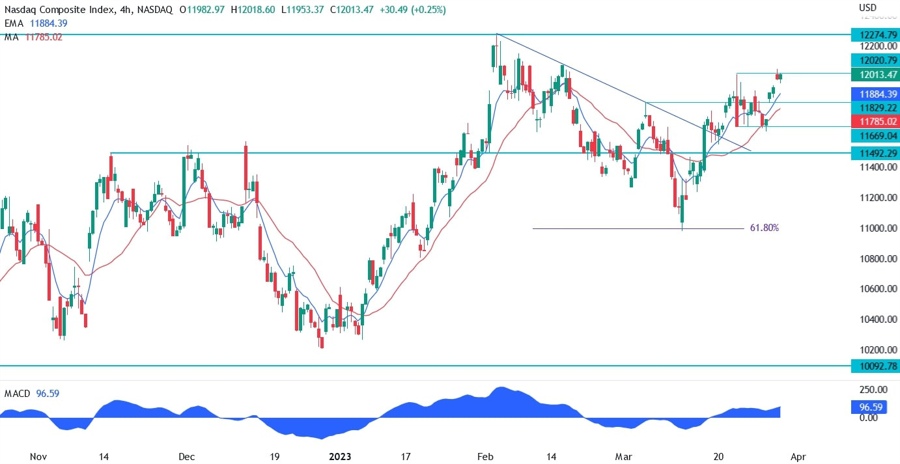
Nasdaq Technical Analysis

On the 4 hour chart below, we can see that at the moment the buyers are trying to break the previous swing resistance at 12020. A break above would open the door for a rally towards the next resistance at 12274.
The red long period moving average will act as dynamic support in case we see a pullback. The sellers at this point will need a break below the 11492 support to regain conviction and target new lower lows.
On the 1 hour chart below, we can see that the market bounced at the 38.2% Fibonacci retracement level before resuming the rally in the original trend. If we get a pullback, a possible level where the buyers may lean onto is the red long period moving average and the 11829 support.


