The RBNZ raised rates by 50 basis points overnight to 4.75% from 4.25%. That is the highest rate in 14 years and there is more to come with the terminal rate expected remaining at 5.5%.
Looking at the NZDUSD hourly chart above, the price spike on the news took the pair up to test its 100 hour MA, but backed off. Another test in the early European session found willing sellers again. However more recently, the price has been able to extend above the 100 hour moving average and buyers are trying to keep the technical bias more positive - at least in the short term.
Stay above the 100 hour moving average is a step one. The other steps include getting above the swing area between 0.6261 and 0.62677, and then the 200 hour MA at 0.62756. The 38.2% retracement of the last move down from the February 14 high is also applied 0.62677. IF the price is to go higher, getting above those levels are the minimum.
Currently, the prices trading above and below the 100 hour moving average as buyers and sellers battle it out.
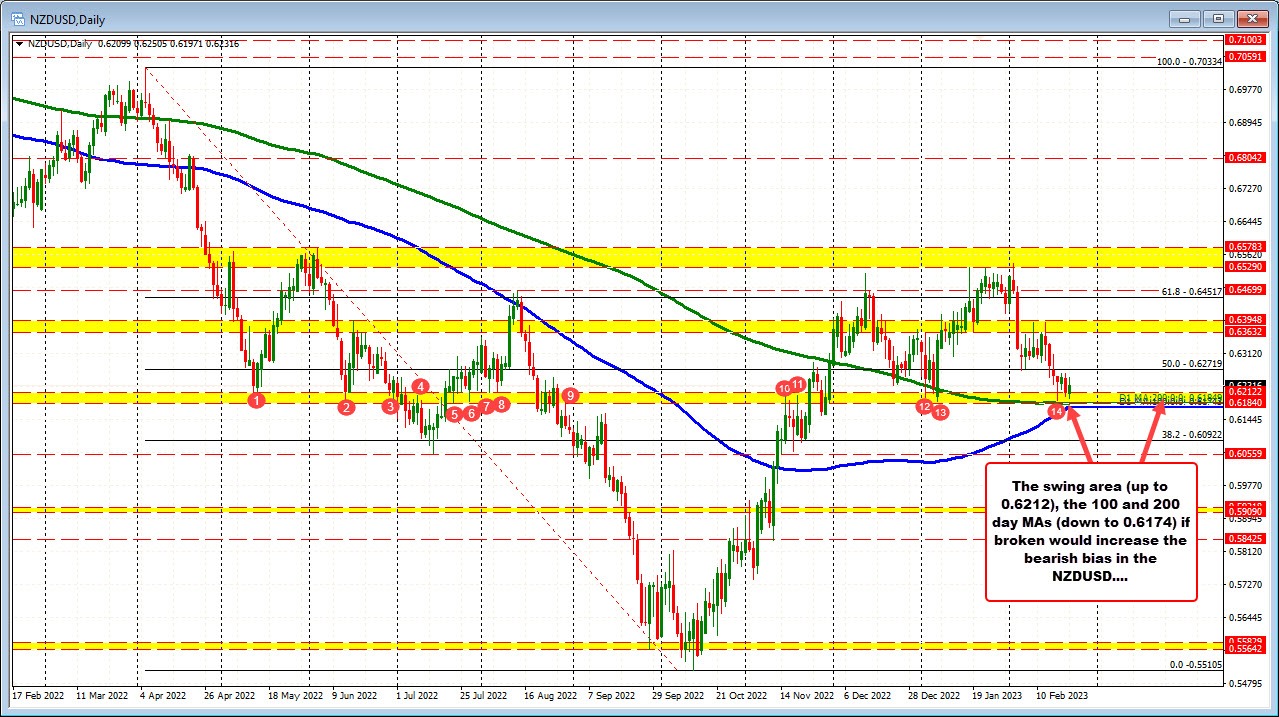
Taking a broader look at the daily chart below, the recent price lows tested the 200 day moving average (green line in the chart below). That moving average currently comes in at 0.61849. The rising 100 day moving average is moving toward that level. It currently is at 0.61743.
There is also a swing area between 0.6184 and 0.6212 adding to the clusters importance going forward. The low price today and yesterday moved within that swing area.
On the downside, getting below that cluster of support would tilt the bias more to the downside.

The RBNZ was deemed to be more hawkish, but the expectations for the Fed has become increasingly more hawkish as well. If stocks move lower, that has been a negative of late for those pairs.
US stocks had its worst day this year yesterday.. They are expected to open modestly higher in trading today.


