On the daily chart below, we can see that the breakout below the key support zone at 1920 has failed. The buyers managed to break above the 1920 resistance after the ISM Services PMI.
This move has got the bears scratching their heads since hot economic data should be bearish for the market as it will require a more hawkish response from the Fed. Traders will look at the technicals now as the picture gets muddier. The red long period moving average will act as resistance now and the sellers will probably lean on it to fade the Friday’s rally.

In the 4 hour chart below, we can see that after the ISM Services PMI report the buyers managed to break both the trendline and the resistance zone. Maybe stops above that zone triggered a squeeze.
Anyway, the sellers will need the price to fall below the 1920 level again to gain conviction and target new lower lows. This will make the 1920 zone also the last line of defence for the buyers in case the price gets there. As of now, the buyers are in control and the first target should be the swing resistance at 1970.

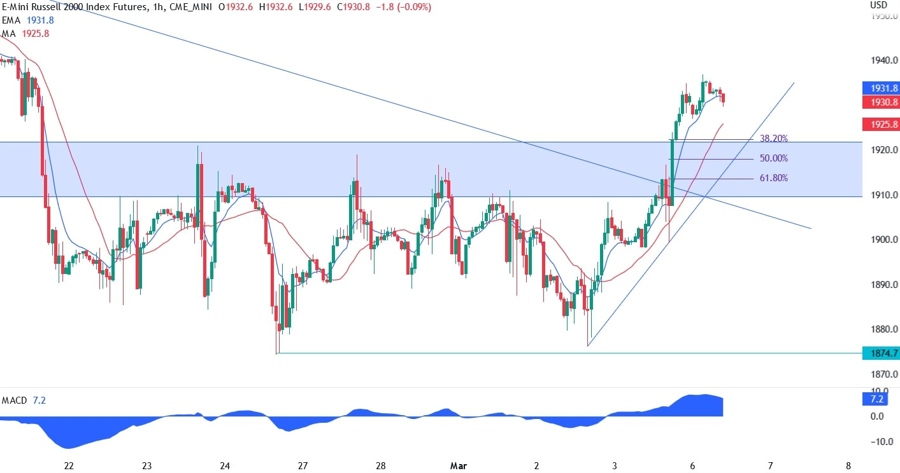
In the 1 hour chart, we can see that the moving averages are now acting as support for this bullish trend. We also have the trendline and Fibonacci retracement levels in the 1920 support zone.
In case we see a pullback, the buyers will be leaning on that trendline to resume the uptrend. The sellers, on the other hand, will look at a break lower to fade the Friday’s rally and start targeting the low at 1874.


