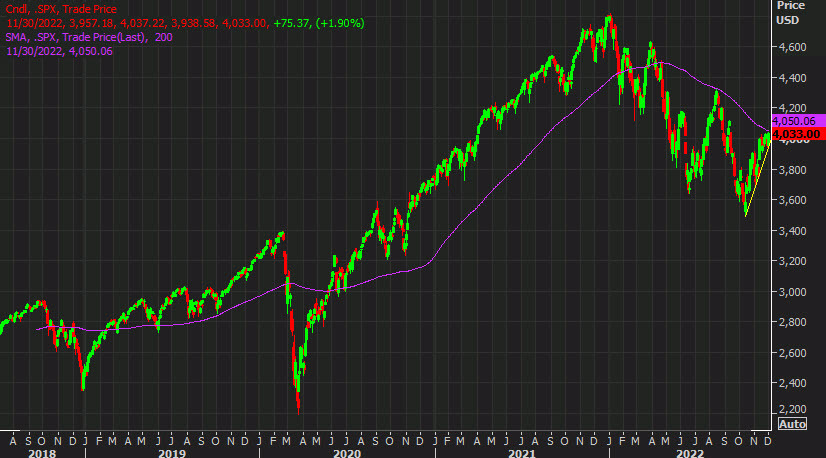
S&P 500 with 200 day moving average
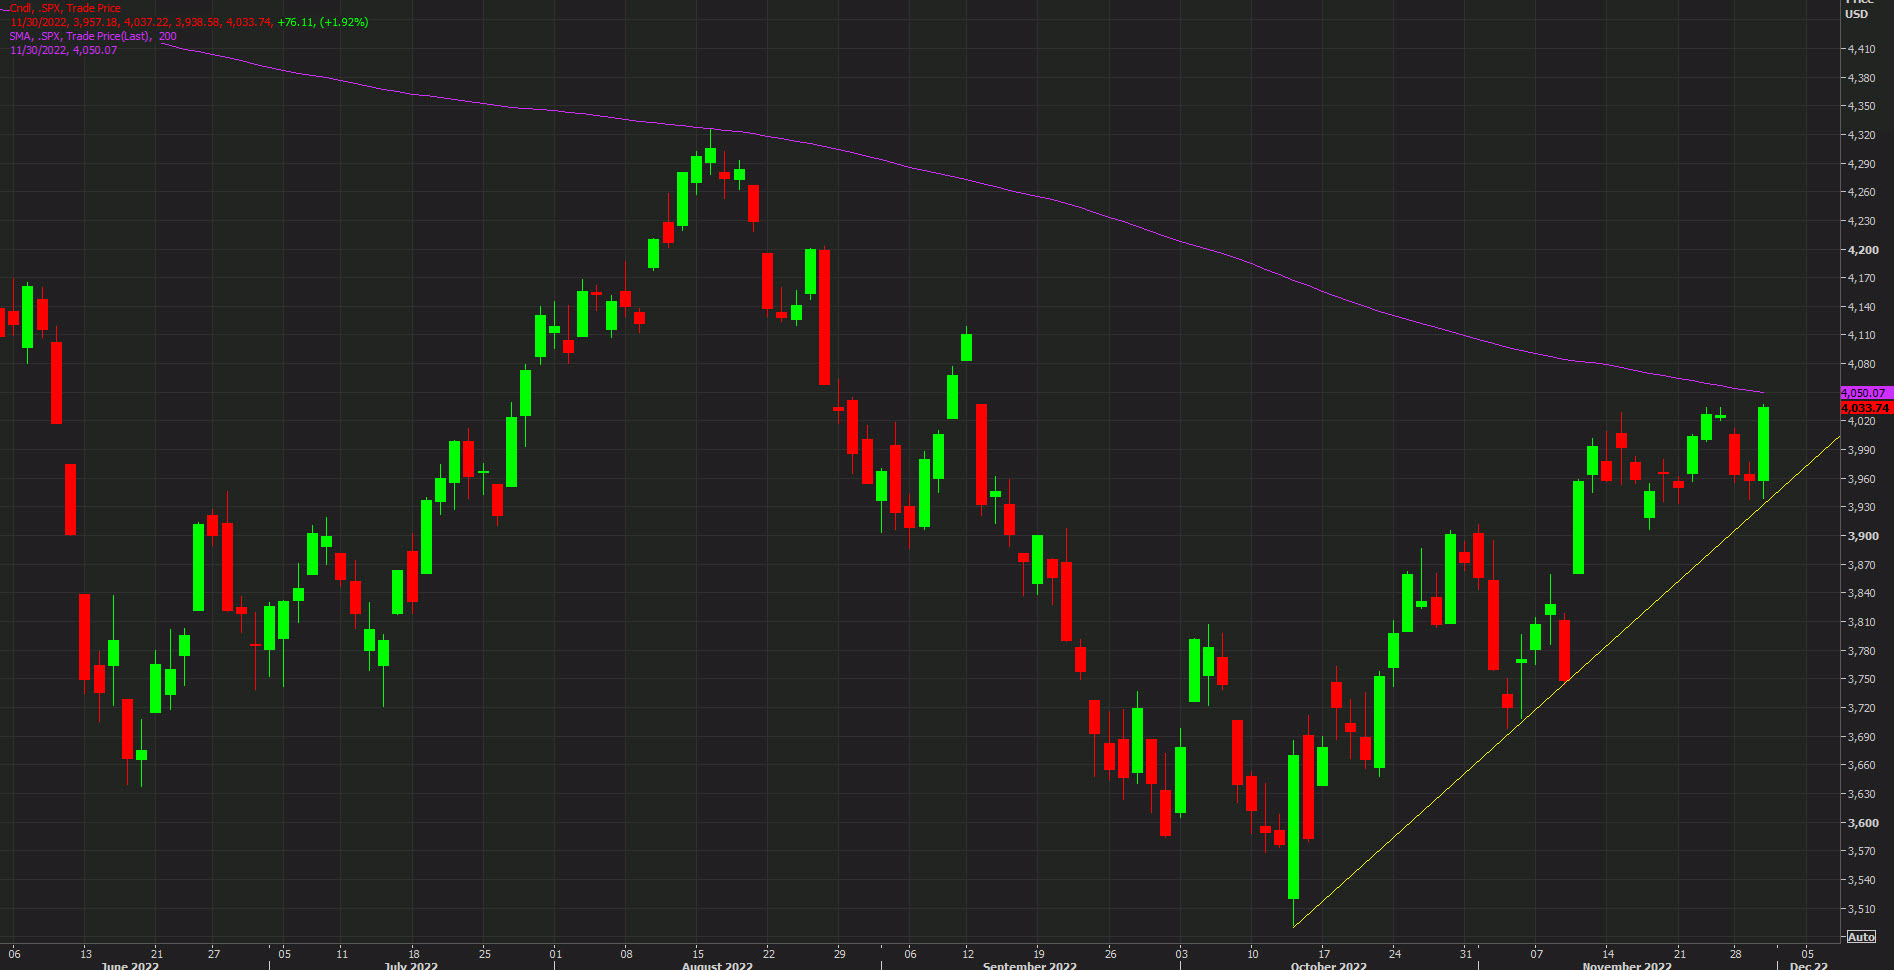
Even the world's least-technical traders need to know this chart right now and the importance of the 4050 level today.
In August, the S&P 500 rallied to almost-precisely the 200-day moving average, which was then at 4326 before crumbling. The high that day was 4326.18 with the DMA at 4326.16.
Now we're having the first look at that line since and it comes after a strong post-CPI rally that's gotten fresh legs since Powell.
Granted, the 200-day isn't going to hold forever and if you go back even a few years it's been cut through both ways without any fanfare. Still, the 200-dma is the single most important line in technical analysis and it will be in the days ahead.