

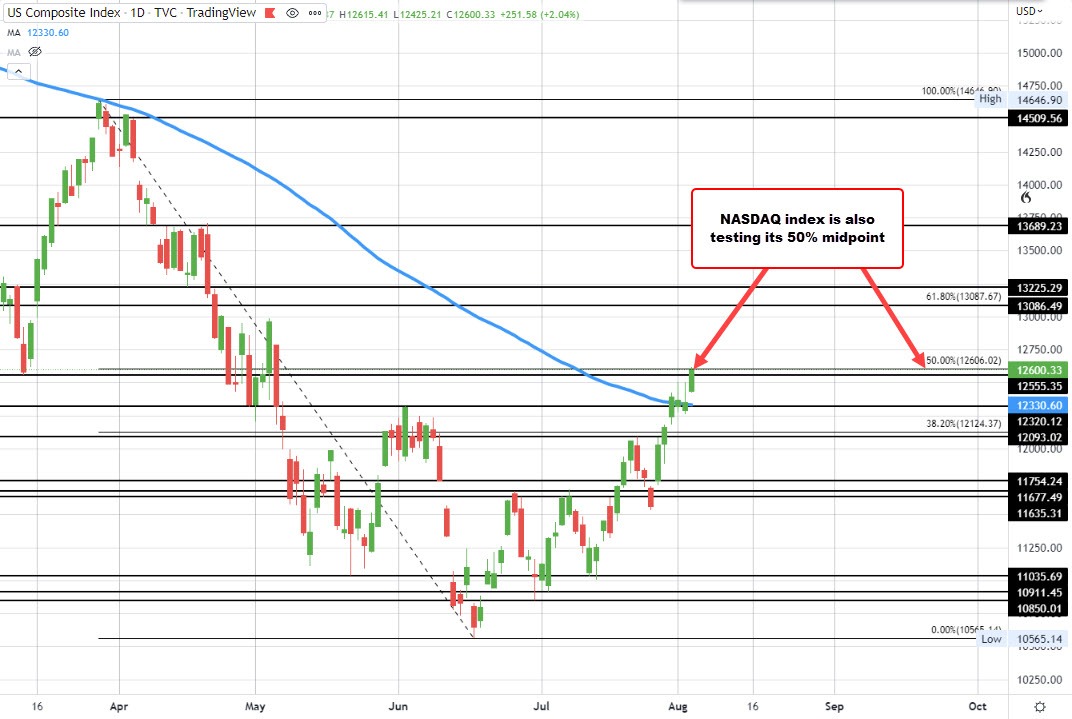
Both the NASDAQ index and the S&P index are trading above their 100 day moving averages, and both are up testing/moving above their 50% midpoint's of the move down from the March high to the June low.
Looking at the S&P index the 50% midpoint comes in at 4137.09. The current price is trading at a new session high at 4145.01 moving above that midpoint level. It's 100 hour moving average is down at 4118.46. Stay above these levels keeps the buyers and control.
For the NASDAQ index, it's 100 day moving average is down at 12330.73. At 50% midpoint is at 12606.02. The current prices trading at 12614.77 with a high price of the day at 12616.90.
So for both the NASDAQ and the S&P index the recent push the upside is not only extending away from its 100 day moving averages below, but also breaking above the 50% midpoint. If those dynamics can continue, the buyers increase their control from a technical perspective.
The gains are coming despite persistent Fed speak pushing toward higher rates now and going forward.and yields higher - at least in the shorter end.

