Fundamental Overview
The USDJPY pair this morning has been on a rollercoaster. Initially, we got a rally following the soft Tokyo CPI numbers and then Takaichi winning the first round of votes in the Japanese election. Things turned around quickly in the run-off as Ishiba won triggering a selloff in the pair.
Takaichi was the one who had been vocal in scrutinising the BoJ for hiking rates too fast. So, Ishiba winning takes some of that pressure away. It’s not like the BoJ will now rush to hike rates of course as macro developments will be the focus.
Next week is going to be a big one for the pair as we get the ISM Manufacturing PMI and the US NFP report. Positive data will likely see the pair drifting higher on rising Treasury yields, while weak figures should keep the bearish momentum going.
USDJPY Technical Analysis – Daily Timeframe
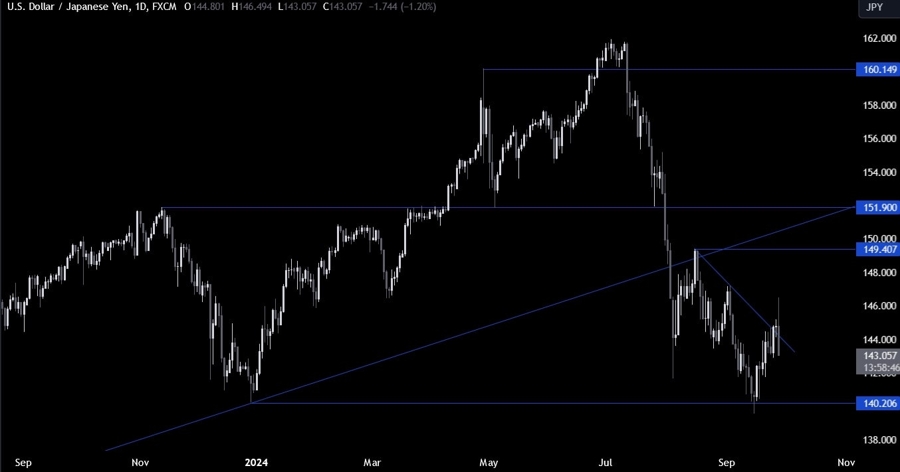
On the daily chart, we can see that USDJPY broke above the trendline recently but got smacked back down following the election results. The sellers will likely start to pile in around these levels to position for a break below the 140.00 handle, while the buyers will want to see the price rallying back above the trendline to increase the bullish momentum into the 150.00 handle.
USDJPY Technical Analysis – 4 hour Timeframe
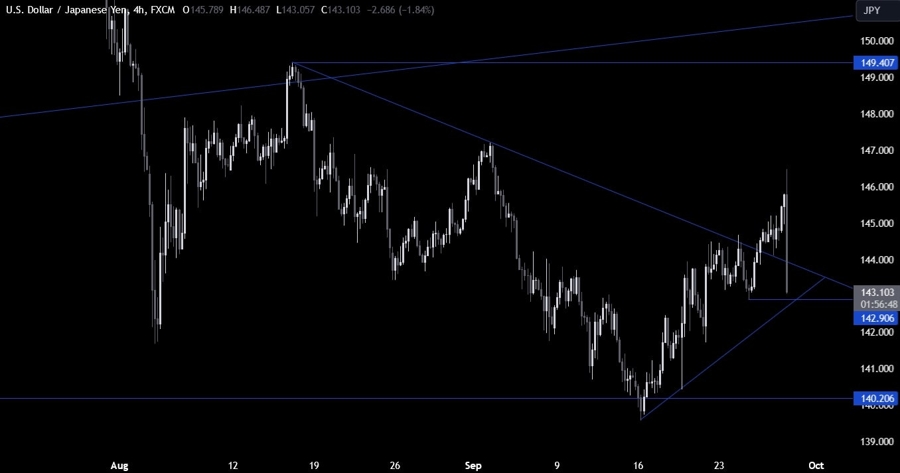
On the 4 hour chart, we can see that we have a strong support zone around the 143.00 handle where we can find the confluence of the upward trendline and the most recent higher low. This is where we can expect the buyers to step in with a defined risk below the trendline to position for a rally into new highs. The sellers, on the other hand, will want to see the price breaking lower to increase the bearish bets into new lows.
USDJPY Technical Analysis – 1 hour Timeframe
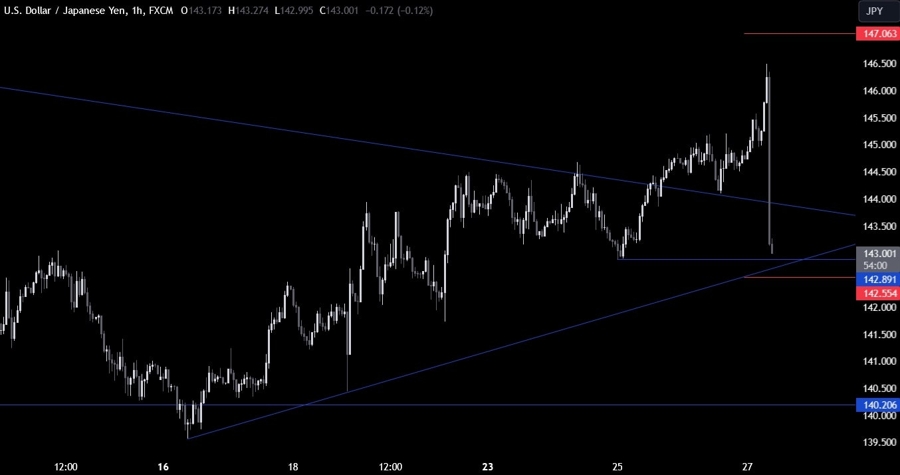
On the 1 hour chart, we can see more clearly the support zone around the 143.00 handle. The selloff looks to be stalling already here as the dip-buyers are starting to pile in. The red lines define the average daily range for today.
Upcoming Catalysts
Today, we conclude the week with the US PCE report.

